

Happy hour. That magical window of time when drinks are flowing, appetizers are half-priced, and the worries of the day seem to melt away.
It’s a tradition that has become deeply ingrained in cultures around the globe, offering a brief respite from the daily grind and a chance to socialize without breaking the bank.
But have you ever wondered just how impactful this time-honored ritual is on the restaurant and bar industry? Or what drives consumers to flock to their favorite spots during these special hours?
If so, you’re going to love this post. I’ve assembled these 44 happy hour statistics to offer insights into the captivating trends, consumer behaviors, and economic nuances that define this favored tradition.
Let’s take a look…
Key takeaways:
1. One-third of all sales of alcoholic beverages occur during happy hour and late-night drink specials.
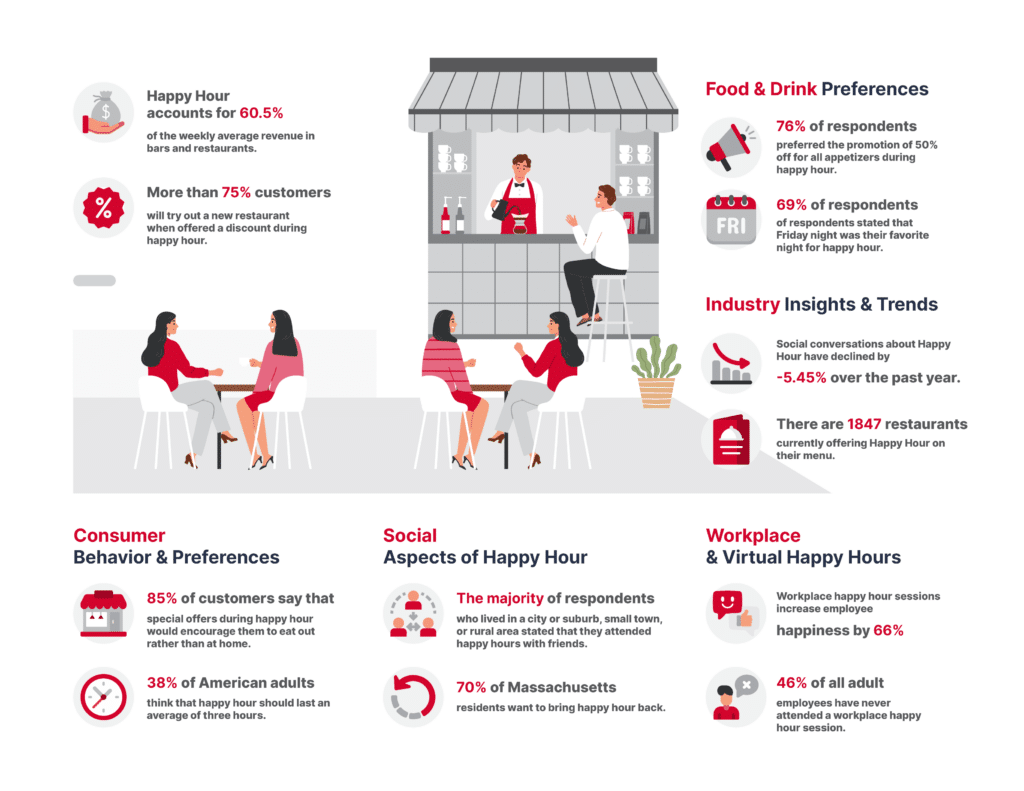
2. Happy hour accounts for 60.5% of the weekly average revenue in bars and restaurants.
3. 40% of consumers globally want to reduce alcohol consumption for health reasons.
4. Workplace happy hour sessions increase employee happiness by 66%.
5. 55% of Americans participated in virtual happy hour.
Key Happy Hour Statistics
Happy hours have become an integral part of the restaurant and bar industry, offering enticing deals to draw in customers.
These key statistics highlight the significance of happy hours in terms of sales and customer behavior.
- One-third of all sales of alcoholic beverages occur during happy hour and late-night drink specials.
- Happy Hour accounts for 60.5% of the weekly average revenue in bars and restaurants.
- The average bill during happy hour is $68.99, which is approximately $8 more than the normal bill during other time slots.
- More than 75% of customers will try out a new restaurant when offered a discount during happy hour.
>> Read more: 25 MUST-SEE Brewery Statistics
Consumer Behavior & Preferences
Understanding what drives consumers to attend happy hours can provide valuable insights for businesses.
This section looks into the motivations and preferences of happy hour goers, shedding light on their habits and desires.
- 63% of US consumers attend happy hours at bars and restaurants for cheaper food.
- 60% attend because drinks are cheaper.
- 39% of customers use happy hours to catch up with friends.
- 45% use the opportunity to relax.
- 40% of consumers globally want to reduce alcohol consumption for health reasons.
- 85% of customers say that special offers during happy hour would encourage them to eat out rather than at home.
- In the US, adults usually spend 2.5 hours at a happy hour.
- 38% of American adults think that happy hour should last an average of three hours.
- Two out of three American adults are more likely to go to a happy hour during warm weather.
- 20% of American happy hour goers state that nothing will stop them from joining attending happy hour.
- The ideal day for American adults to hit the bars after work is Tuesday.
- 63% of happy hour goers state that they prefer to try new things during happy hour.
- On any given day, happy hour goers prefer to start between 4 p.m. and 5 p.m.
>> Read more: 41 Super INTERESTING Beer Statistics
Industry Insights & Trends
The landscape of the restaurant and bar industry demands a keen understanding of its latest trends and patterns.
As happy hours continue to be a pivotal part of this sector, it’s essential to stay updated with the most recent shifts and developments.
In this section, we delve into the intricate dynamics of the industry, shedding light on how happy hours are shaping revenues, customer interactions, and overall business strategies.
- Bars with happy hours had 33 percent higher transactions than those without during the month of February.
- Bars with a happy hour program saw an average increase in revenue of 26 percent during happy hour.
- Transactions increased by an average of 24 percent during happy hour for bars with such a program, compared with non-happy-hour venues.
- Non-happy-hour bars that typically generated more overall revenue by about 10 percent were outperformed by their happy-hour-offering peers by more than 20 percent during those hours.
- The peak time for both revenue and transactions, with or without a happy hour, is between 7 p.m. and 8 p.m.
- Social conversations about Happy Hour have declined by -5.45% over the past year.
- The fastest-rising consumer need for Happy Hour is Snack.
- The dominating diet for Happy Hour is Vegan.
- There are 1847 restaurants currently offering Happy Hour on their menu.
>> Read more: 47 MUST-SEE Cocktail Trends & Statistics
Food & Drink Preferences
Happy hour is synonymous with tantalizing food and refreshing drinks.
As patrons eagerly await these special hours, their choices in food and beverages often reflect their moods, preferences, and even the latest culinary trends.
In this section, we look at the top picks that dominate the happy hour menus, offering a glimpse into the palate preferences of today’s consumers.
- More than half of customers under the age of 35 make late-night restaurant visits several times a month.
- One-third of 18- to 34-year-olds agree that they would visit restaurants late more often if these locations remained open later.
- 41% of customers aged 21-34 said that late-night specials on adult beverages are very important to their decision regarding whether to visit a late-night restaurant.
- 42% of respondents stated that they were most likely to order a beer during happy hour.
- 59% of customers preferred domestic beer while just 20% preferred imported beer at happy hour.
- 73% of respondents stated that the most appealing happy hour food special was a free or low-cost buffet.
- 76% of respondents preferred the promotion of 50% off for all appetizers during happy hour.
- 69% of respondents stated that Friday night was their favorite night for happy hour.
Social Aspects of Happy Hour
Happy hours are as much about socializing as they are about great deals.
This section explores the social dynamics of happy hours, from the preferred company to regional preferences.
- The majority of respondents who lived in a city or suburb, small town, or rural area stated that they attended happy hours with friends.
- 70% of Massachusetts residents want to bring happy hour back.
Workplace & Virtual Happy Hours
Happy hours have evolved beyond the confines of local bars and eateries, seamlessly integrating into office cultures and online gatherings.
Take a look at these statistics to understand the growing appeal and significance of workplace and virtual happy hour sessions in today’s interconnected world.
- Workplace happy hour sessions increase employee happiness by 66%.
- Millennial employees are more likely to attend office happy hours than any other generation.
- 46% of all adult employees have never attended a workplace happy hour session.
- Men are more likely to attend after-work happy hour events than women.
- 55% of Americans participated in virtual happy hour.
- The average duration of a virtual happy hour with coworkers is 35 minutes.
- Americans prefer six people attending a virtual happy hour or party.
- Zoom is America’s favorite app to socialize on.
Sources:
- https://www.posist.com/
- https://www.posist.com/
- https://www.posist.com/
- https://www.posist.com/
- https://www.statista.com/statistics/219180/consumer-reasons-for-attending-happy-hour-at-restaurants-and-bars/
- https://www.statista.com/statistics/219180/consumer-reasons-for-attending-happy-hour-at-restaurants-and-bars/
- https://www.statista.com/statistics/219180/consumer-reasons-for-attending-happy-hour-at-restaurants-and-bars/
- https://www.statista.com/statistics/219180/consumer-reasons-for-attending-happy-hour-at-restaurants-and-bars/
- https://www.posist.com/
- https://www.posist.com/
- https://www.newsweek.com/more-fun-why-limit-happy-hour-just-one-hour-1712452
- https://www.newsweek.com/more-fun-why-limit-happy-hour-just-one-hour-1712452
- https://www.newsweek.com/more-fun-why-limit-happy-hour-just-one-hour-1712452
- https://www.newsweek.com/more-fun-why-limit-happy-hour-just-one-hour-1712452
- https://www.newsweek.com/more-fun-why-limit-happy-hour-just-one-hour-1712452
- https://www.newsweek.com/more-fun-why-limit-happy-hour-just-one-hour-1712452
- https://www.newsweek.com/more-fun-why-limit-happy-hour-just-one-hour-1712452
- https://www.nrn.com/create-future-foodservice/restaurateur-danny-trejo-tells-create-attendees-persevere
- https://www.nrn.com/create-future-foodservice/restaurateur-danny-trejo-tells-create-attendees-persevere
- https://www.nrn.com/create-future-foodservice/restaurateur-danny-trejo-tells-create-attendees-persevere
- https://www.nrn.com/create-future-foodservice/restaurateur-danny-trejo-tells-create-attendees-persevere
- https://www.nrn.com/create-future-foodservice/restaurateur-danny-trejo-tells-create-attendees-persevere
- https://tastewise.io/foodtrends/happy%20hour
- https://tastewise.io/foodtrends/happy%20hour
- https://tastewise.io/foodtrends/happy%20hour
- https://tastewise.io/foodtrends/happy%20hour
- https://restaurant.org/
- https://restaurant.org/
- https://restaurant.org/
- https://www.statista.com/
- https://www.statista.com/
- https://www.statista.com/
- https://www.statista.com/
- https://www.statista.com/
- https://www.statista.com/
- https://www.bostonherald.com/2021/07/21/new-poll-says-70-of-bay-staters-support-bringing-happy-hour-back/
- https://www.inc.com/heather-wilde/the-surprising-way-anheuser-busch-wants-to-help-your-employee-retention.html
- https://today.yougov.com/society/articles/19757-millennials-embrace-office-happy-hour?
- https://today.yougov.com/society/articles/19757-millennials-embrace-office-happy-hour?
- https://today.yougov.com/society/articles/19757-millennials-embrace-office-happy-hour?
- https://fourloko.com/virtual-happy-hour-statistics/
- https://fourloko.com/virtual-happy-hour-statistics/
- https://fourloko.com/virtual-happy-hour-statistics/
- https://fourloko.com/virtual-happy-hour-statistics/