


Have you ever wondered what’s really happening behind the scenes of your favorite watering hole?
The bar industry, with its rich history and rapidly evolving trends, is full of surprises. While we all love a good night out or a casual drink with friends, there’s a whole world of data and insights that shape our experiences.
I’ve gathered 55 fascinating bar industry statistics that offer a fresh perspective on the industry, from consumer habits to global trends.
So whether you’re an entrepreneur eyeing the bar business, a bartender curious about the bigger picture, or just someone who loves a good night out, these statistics offer a glimpse into the nightlife world.
Let’s get into it…
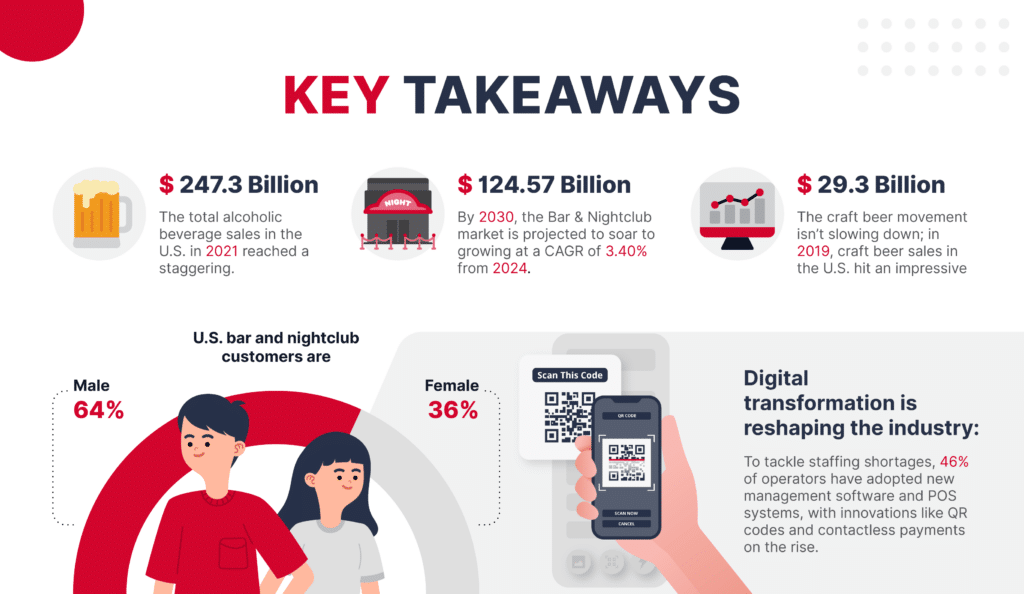
Key takeaways:
1. The total alcoholic beverage sales in the U.S. in 2021 reached a staggering $247.3 billion.
2. By 2030, the Bar & Nightclub market is projected to soar to USD 124.57 Billion, growing at a CAGR of 3.40% from 2024.
3. 64% of U.S. bar and nightclub customers are male, while only 36% are female.
4. The craft beer movement isn’t slowing down; in 2019, craft beer sales in the U.S. hit an impressive $29.3 billion.
5. Digital transformation is reshaping the industry: To tackle staffing shortages, 46% of operators have adopted new management software and POS systems, with innovations like QR codes and contactless payments on the rise.
Key Bar Industry Statistics
The bar industry is a very important sector in the hospitality world, with its roots deeply embedded in the culture and lifestyle of many of us.
From craft beers to nightclubs, this industry has seen various trends and shifts over the years.
Here are some key statistics that provide an overview of the bar industry.
- The total alcoholic beverage sales in the U.S. in 2021 was $247.3 billion.
- The bar and nightclub revenue in the U.S. in 2021 was about $23.1 billion.
- There are 2.2 bars per 10,000 people in the United States.
- From 2016 – 2021, bars and nightclubs in the US had an annual growth rate of -4.7%.
- In 2019, the bar industry employed over 4.4 million people in the United States.
- The number of businesses in the bar and nightclub sector in 2021 was approximately 67 thousand.
- The U.S. sports bar with the highest sales is Buffalo Wild Wings.
- The United States has the largest spirits market by revenue, with a total value of $91.1 billion (2020).
- In 2020, the global alcoholic beverage market size was valued at $1,777.4 billion.
- The Bar & Nightclub market is projected to reach USD 124.57 Billion by 2030, growing at a CAGR of 3.40% from 2024 to 2030.
>> Read more: 41 Super INTERESTING Beer Statistics
Consumer Behavior & Preferences
Understanding consumer behavior is crucial for any industry, and the bar sector is no exception.
These statistics shed light on the preferences, habits, and choices of consumers when it comes to frequenting bars and nightclubs.
- Over 31% of adult consumers visit a bar or tavern at least once a week.
- 64% of U.S. bar and nightclub customers are male while 36% are female.
- The average American household spends $565 per year on alcohol, mostly at bars and restaurants.
- 7 million people in the U.S. regularly purchase wine at bars or nightclubs.
- Over 20 million people visited a bar or nightclub within a casino in the U.S. in the past year.
- Only 3% of people use coupons they receive for bars or nightclubs.
- The average consumer orders 2.3 drinks per nightclub visit.
- Beer accounts for 10.3% of total beverage consumption in the U.S., with 6% of Americans drinking at least one beer daily.
- In 2021, 47.5% of American adults reported drinking alcohol in the past year.
- 55% of consumers frequent bars and nightclubs as often as the previous year, with 70% visiting the same types of bars each time.
>> Read more: 45 INTRIGUING Wine Statistics
Trends In The Bar Industry
The bar and nightclub industry is always changing, with new trends emerging regularly.
From craft beer popularity to the rise of taprooms, these statistics provide insights into the latest industry trends that are shaping consumer choices.
- In 2019, craft beer sales in the U.S. reached $29.3 billion.
- Breweries have been booming since the 90s.
- The craft beer craze really picked up around 2006.
- Since around 2019, rosé beer has been a popular type of beer made by craft brewers.
- In 2022, bars are operating in a world that looks a lot more like it did pre-pandemic.
- The beer market is expected to keep growing by 9.38% each year.
- Breweries had to up their ecommerce game in response to the pandemic.
- Taprooms, a new form of on-premise beer drinking spaces, are gaining popularity.
- By 2025, 47% of spending and 25% of volume consumption of beer will be attributed to bars, restaurants, and breweries.
- Self-service taprooms are emerging trends in the US, offering benefits like reduced waste, reduced wait times, and addressing labor shortages.
- Nightclubs, though only 8.6% of the industry, make up a majority of the most lucrative venues.
>> Read more: 47 MUST-SEE Cocktail Trends & Statistics
Economic & Operational Insights
The economic health and operational aspects of the bar industry play a pivotal role in its overall success.
These statistics look into the financial metrics, market size, and operational challenges and innovations that bars and nightclubs face.
- The market size of the Bars & Nightclubs industry increased by 14.6% in 2022.
- The market size, measured by revenue of the Bars & Nightclub industry was $36.5 billion.
- The primary negative factors affecting the Bars & Nightclub industry are high competition and low barriers to entry.
- The average bar startup costs range between $110,000 and $550,000, depending on size.
- The hospitality industry, including bars and nightlife, faced challenges like rising costs, inflation, and labor shortages due to the pandemic.
- Inflation has caused 26% of consumers to switch to buying beverages for at-home consumption.
- 60% of women and 50% of men have changed their frequency of visiting bars and restaurants due to inflation.
- The average VIP bottle service price is $239, while the average drink price is $10.50.
- The average bar in the U.S. earns between $25,000 to $30,000 per week and spends about $24,000 monthly on staffing, inventory, and rent/mortgage.
- The average cost of a liquor license in the U.S. is $4,500.
- From 2017 – 2022, the market size of the Bars & Nightclub industry in the US has grown by 3.0% per year on average.
- In 2022, the Bars & Nightclub industry in the US was the 9th ranked Accommodation and Food Services industry by market size and the 299th largest in the US.
- The market size of the Bars & Nightclub industry in the US increased faster than the economy overall.
- To address staffing shortages, 46% of operators adopted new management software and POS systems. Other digital innovations include QR codes and contactless payments.
- Digitization has led to the adoption of self-service payment systems, which have increased tipping.
- Beer and ale make up 42% of sales at specific bar and nightclub locations, with distilled spirits accounting for another 30%. This results in over 196 million barrels of beer sold annually.
- Taverns, which are the most common type of establishment, represent 32% of the industry’s total receipts annually.
>> Read more: 56 INTRIGUING Gin Facts & Statistics
Bartender & Employment Statistics
Source: Zippia.com 
Bartenders are the heart and soul of any bar or nightclub. Their role is not just about serving drinks but also about creating an atmosphere that customers enjoy.
I didn’t provide too many stats specifically on bartenders as we have a full dedicated post on this that you can check out, linked below.
- Employment of bartenders is projected to grow 18% from 2021 to 2031.
>> Read more: 41 Bartender Statistics That Will ASTONISH You
Geographical Insights
The success and challenges of the bar industry can vary significantly based on geography.
From the number of establishments in different states to the trends in international markets like the UK and Canada, these statistics offer a geographical perspective on the industry’s landscape.
- Wisconsin has the highest number of bar and nightclub locations at 4,489, followed by California (4,388) and Texas (4,283).
- The U.K. nightclub industry has seen revenues contract by 5.7% annually since 2014, with total revenues now at GBP 2 billion.
- 25% of U.K. nightclubs have closed since 2004 due to new regulations.
- The U.K. nightclub industry still supports 80,000 jobs across 6,800 active locations.
- The Canadian bar and nightclub industry has experienced an average annualized growth rate of 0.4% since 2012.
- The Canadian nightclub industry supports the employment of about 43,000 people at more than 5,200 locations throughout the country.
>> Read more: 44 CAPTIVATING Rum Statistics
Sources:
- https://www.statista.com/topics/1752/bars-and-nightclubs/#topicOverview
- https://blog.gitnux.com/bar-industry-statistics/
- https://blog.gitnux.com/bar-industry-statistics/
- https://blog.gitnux.com/bar-industry-statistics/
- https://blog.gitnux.com/bar-industry-statistics/
- https://www.statista.com/topics/1752/bars-and-nightclubs/#topicOverview
- https://www.statista.com/topics/1752/bars-and-nightclubs/#topicOverview
- https://blog.gitnux.com/bar-industry-statistics/
- https://blog.gitnux.com/bar-industry-statistics/
- https://www.verifiedmarketresearch.com/product/bars-and-nightclubs-market/
- https://blog.gitnux.com/bar-industry-statistics/
- https://blog.gitnux.com/bar-industry-statistics/
- https://blog.gitnux.com/bar-industry-statistics/
- https://www.statista.com/topics/1752/bars-and-nightclubs/#topicOverview
- https://www.statista.com/topics/1752/bars-and-nightclubs/#topicOverview
- https://www.statista.com/topics/1752/bars-and-nightclubs/#topicOverview
- https://www.nightlifeassociation.org/
- https://www.statista.com/topics/1752/bars-and-nightclubs/#topicOverview
- https://budgetbranders.com/blog/2020-drinking-statistics-and-habits-trends-you-can-expect-for-your-bar-business/
- https://www.nightlifeassociation.org/
- https://blog.gitnux.com/bar-industry-statistics/
- https://pos.toasttab.com/blog/on-the-line/bar-industry-trends-and-statistics
- https://pos.toasttab.com/blog/on-the-line/bar-industry-trends-and-statistics
- https://pos.toasttab.com/blog/on-the-line/bar-industry-trends-and-statistics
- https://pos.toasttab.com/blog/on-the-line/bar-industry-trends-and-statistics
- https://pos.toasttab.com/blog/on-the-line/bar-industry-trends-and-statistics
- https://pos.toasttab.com/blog/on-the-line/bar-industry-trends-and-statistics
- https://pos.toasttab.com/blog/on-the-line/bar-industry-trends-and-statistics
- https://pos.toasttab.com/blog/on-the-line/bar-industry-trends-and-statistics
- https://www.sbdcnet.org/small-business-research-reports/bar-business-nightclub/
- https://www.nightlifeassociation.org/
- https://www.nightlifeassociation.org/
- https://www.ibisworld.com/industry-statistics/market-size/bars-nightclubs-united-states/
- https://www.ibisworld.com/industry-statistics/market-size/bars-nightclubs-united-states/
- https://www.ibisworld.com/industry-statistics/market-size/bars-nightclubs-united-states/
- https://www.sbdcnet.org/small-business-research-reports/bar-business-nightclub/
- https://www.sbdcnet.org/small-business-research-reports/bar-business-nightclub/
- https://www.sbdcnet.org/small-business-research-reports/bar-business-nightclub/
- https://www.nightlifeassociation.org/
- https://www.investopedia.com/
- https://www.investopedia.com/
- https://www.ibisworld.com/industry-statistics/market-size/bars-nightclubs-united-states/
- https://www.ibisworld.com/industry-statistics/market-size/bars-nightclubs-united-states/
- https://www.ibisworld.com/industry-statistics/market-size/bars-nightclubs-united-states/
- https://www.sbdcnet.org/small-business-research-reports/bar-business-nightclub/
- https://www.sbdcnet.org/small-business-research-reports/bar-business-nightclub/
- https://www.nightlifeassociation.org/
- https://www.nightlifeassociation.org/
- https://www.sbdcnet.org/small-business-research-reports/bar-business-nightclub/
- https://www.nightlifeassociation.org/
- https://www.ibisworld.com/industry-statistics/market-size/bars-nightclubs-united-states/
- https://www.ibisworld.com/industry-statistics/market-size/bars-nightclubs-united-states/
- https://www.ibisworld.com/industry-statistics/market-size/bars-nightclubs-united-states/
- https://www.ibisworld.com/industry-statistics/market-size/bars-nightclubs-united-states/
- https://www.ibisworld.com/industry-statistics/market-size/bars-nightclubs-united-states/